Analysis of defaults of Belarusian companies
Introduction
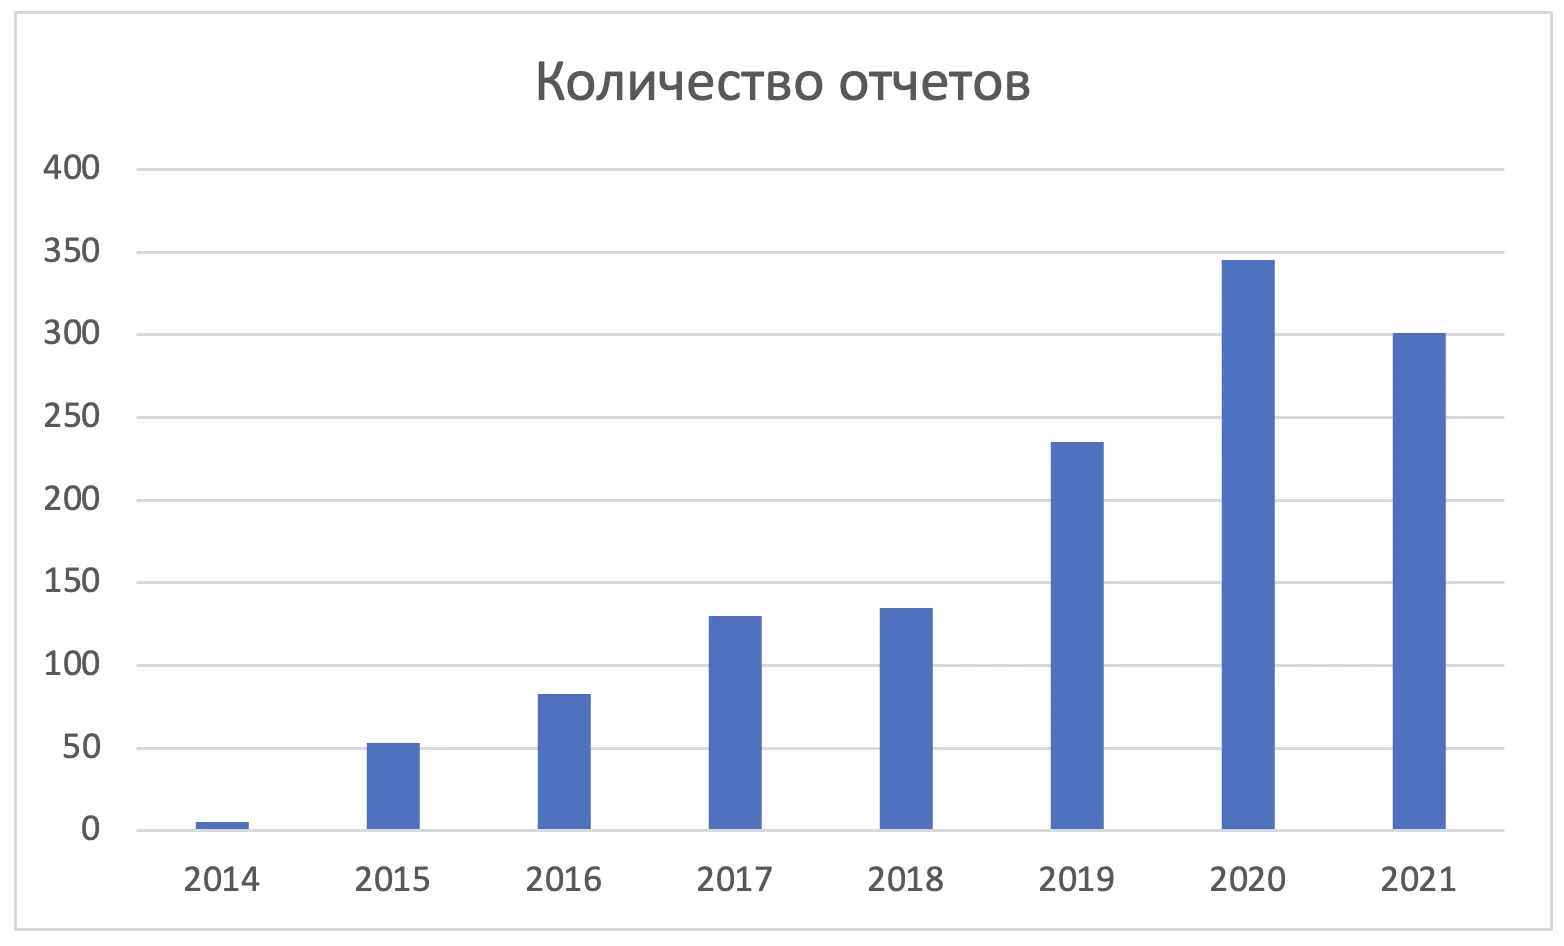
Recently we have seen a wave of defaults on corporate bonds of Belarusian issuers. As many of you know, for several years our team has been analysing companies and assigning reliability scores using our own model. Every quarter we collect hundreds of financial statements, and we now have two valuable things. First, we have collected more than a thousand financial statements since 2014. Second, we now have a sample of defaulted companies — small, but a sample nonetheless. So we wanted to find patterns that could help predict default risk in the future.
Source data
Our database currently holds 1,287 reports on 250 companies. By a report we mean a combination of a quarterly or annual balance sheet and income statement, so the database contains 1,287 income statements and 1,287 balance sheets. All statements were taken from the official EPFR portal or company websites.
Now let's look at the issuers that defaulted.
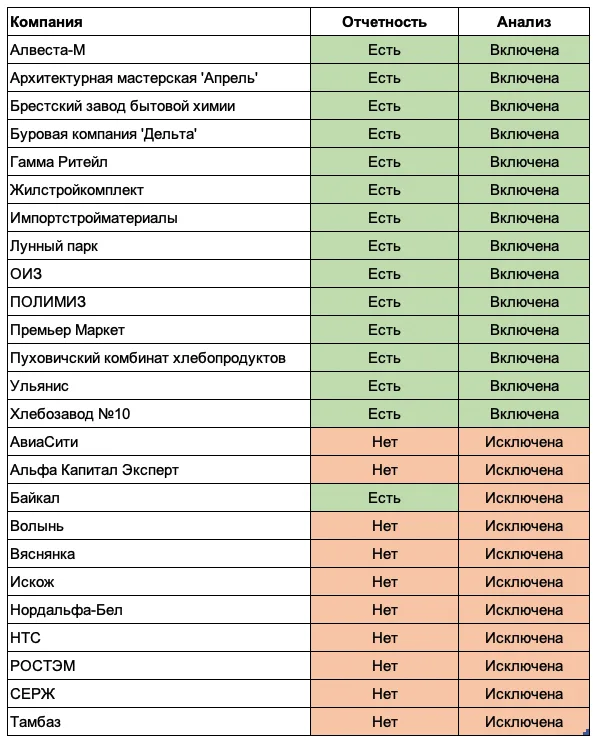
According to our data, 25 Belarusian companies have defaulted on bonds in total. For 10 of them we could not find financial statements in public sources.
We also excluded Baikal ALC from the analysis. Baikal continues to meet its obligations to the vast majority of investors. However, some investors bought bonds through a dubious scheme at one of the brokers. The money from selling these bonds never reached Baikal's accounts, so the company refused to pay the coupon on them, which technically constituted a default. One can argue whether this is a real default, but in any case it was caused by management's principled position towards particular investors, not by financial inability to meet obligations. So analysing Baikal would not help identify the financial precursors of default.
Our model
A few words about our existing credit scoring model for issuers. It was developed several years ago and is based on 8 indicators in 3 areas. The score is on a 10-point scale, and each of the three areas accounts for a third of the final result.
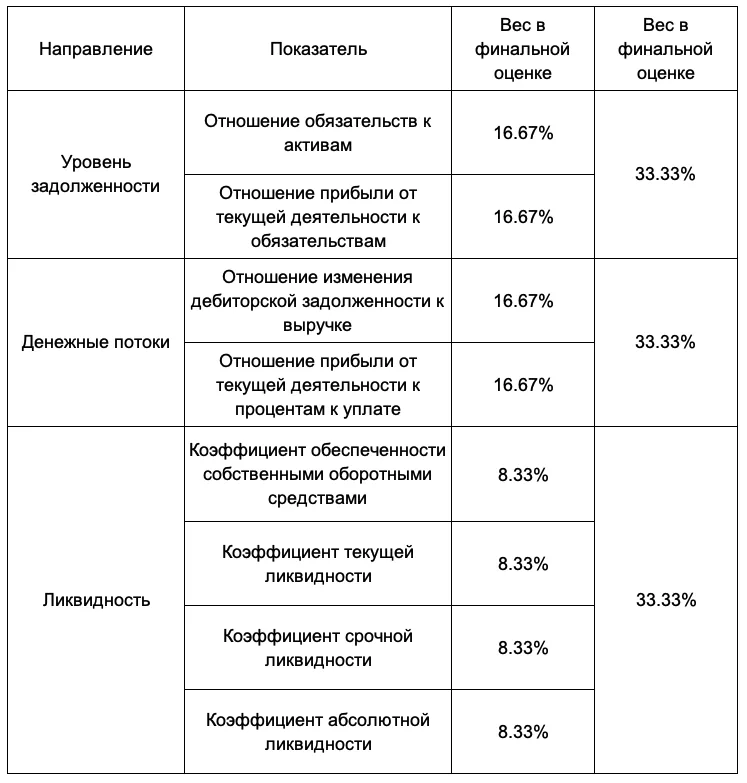
Points for individual indicators are assigned relative to other companies. For example, if a company's ratio is in the best 10% of the whole sample, it gets 10 points for that indicator; if it is in the best 20%, it gets 9 points, and so on.
Which indicators signal default risk?
Let's compare the average scores for all indicators in the groups of defaulted and non-defaulted issuers (for defaulted companies we took the last statements available before the default):
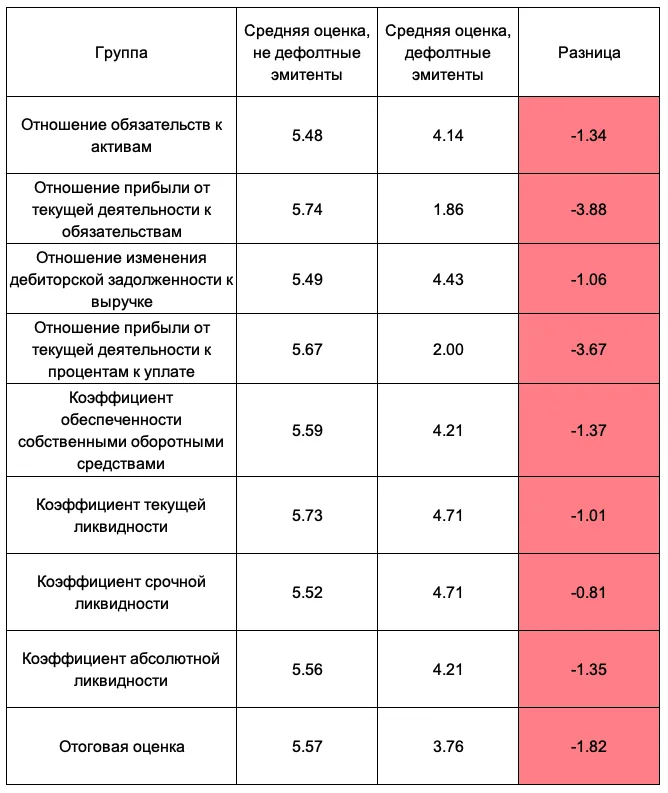
All indicators are on average 1.82 points worse in the default group, but the indicators related to operating profit stand out in particular. Let's look more closely at the difference in profitability between the groups:
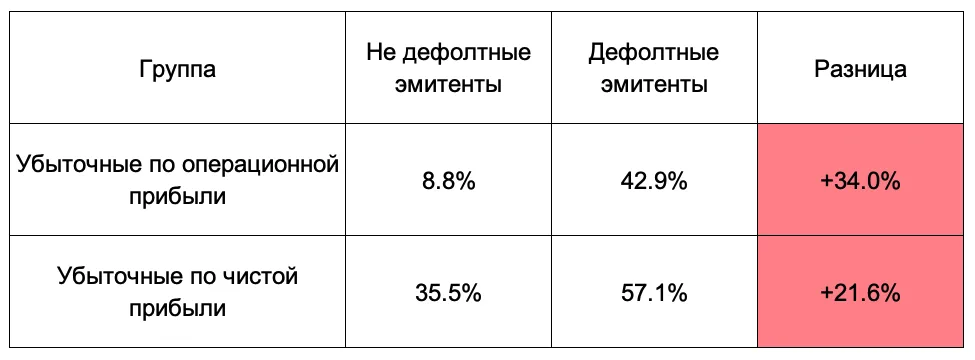
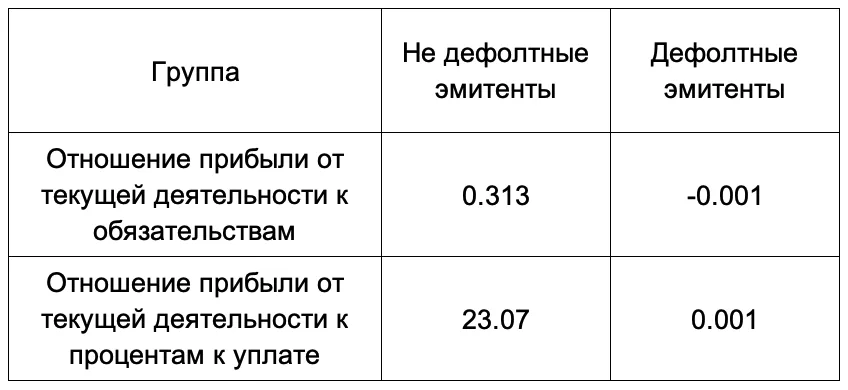
Defaulted issuers are on average almost 5 times more likely to have an operating loss and more than 1.5 times more likely to have a net loss. The absolute ratios are also noticeably worse in the default group.
Conclusions
All indicators in our model were noticeably worse for the group of defaulted issuers, and the indicators related to operating profit were much worse.
Translated from Russian. First published in the “Belarusian Issuers” Telegram channel. Charts and screenshots are in Russian. This is not investment advice.